
Quality of hire is the measurable value a new employee creates after joining, judged against what the role actually needed. Start tracking four things at once: performance against role expectations, first-year retention, time to full productivity, and hiring manager satisfaction. Measure them at standard checkpoints (30, 90, and 365 days) so you build a trendline, not a snapshot.
TL;DR:
- High-performing hires tend to come from well-defined sourcing channels and recruiters, making targeted recruitment efforts more effective.
- Using role-specific milestones helps accurately measure ramp-to-productivity and identify onboarding improvements for roles with long adjustment periods.
- Internal benchmarking over multiple cohorts provides meaningful trends in quality of hire, rather than relying on industry averages that vary widely in calculation.
- Combining performance, retention, satisfaction, and behavioral data into a composite score offers a more reliable indicator of hiring success than any single metric.
- Automated data systems that integrate performance, retention, and survey responses reduce manual effort and improve the reliability of quality of hire measurement.
Table of Contents
- What Are the Core Quality of Hire Metrics?
- How Do You Calculate a Composite Quality of Hire Score?
- Where Do You Collect Quality of Hire Data, and When?
- How Do You Use Quality of Hire Data to Improve Hiring?
- What Limits Quality of Hire Measurement?
- Measuring Culture and Behavioral Fit: A True Colors Approach
- How Do You Benchmark Quality of Hire Against Industry Standards?
- How Does Quality of Hire Affect Business Outcomes?
- What Tools Help Automate Quality of Hire Tracking?
- What Legal and Ethical Issues Come Up in Quality of Hire Measurement?
- Quality of Hire Is a Business Metric, Not an HR Report
- Turn Culture Fit Into a Measurable Hiring Input With Truecolorsintl
- Sources
- FAQ
What Are the Core Quality of Hire Metrics?
Quality of hire isn't one number. It's a composite built from several observable outcomes, because no single data point tells you whether a hire actually worked out. Experts recommend combining quantitative outcomes like performance and retention with qualitative signals like manager satisfaction and 360 feedback, since either category alone tends to mislead you in different ways.
Here's how to operationalize the six indicators that matter most:
- Job performance. Normalize review scores across managers on a consistent scale (1 to 5, or percentage of goals met) and pair them with objective KPIs where the role allows it. A sales rep's quota attainment is harder to game than a subjective "exceeds expectations" checkbox.
- Retention. Track first-year retention and 90-day early churn separately. Early churn usually signals a hiring or onboarding mismatch; later attrition often points to management or compensation issues instead.
- Ramp to productivity. Define role-specific milestones. A customer support hire might hit full ticket volume by week six. An enterprise account executive might not close a deal solo for four months. Use the milestone date itself as your metric, not a generic 90-day assumption.
- Hiring manager satisfaction. A short survey, three to five questions, delivered at 90 days and again at 12 months, captures whether the manager would hire this person again.
- 360 and engagement signals. Peer feedback and engagement scores add texture, but they shouldn't replace outcome data. A well-liked employee who misses every deadline is not a quality hire, no matter how positive the engagement pulse looks.
- Cultural and behavioral alignment. Convert vague notions of "fit" into observable behaviors, like collaboration style or communication pace, that you can actually score during interviews and again after 90 days.
Quality of hire is best understood as a latent outcome inferred from multiple post-hire indicators rather than something you observe directly. That's precisely why a composite scorecard beats any single metric.
How Do You Calculate a Composite Quality of Hire Score?
The simplest formula, popularized in recruiting circles, is Quality of Hire = (PR + HP + HR) / N, where PR is the job performance rating, HP is the percentage of hires reaching acceptable productivity in a set window, and HR is the percentage retained after one year. This three-input average gives you a fast, defensible starting point.
To build it, normalize every input to a 0 to 100 scale before averaging:
- Convert performance ratings (say, 1 to 5) to a percentage: a 4 out of 5 becomes 80.
- Convert productivity into a yes/no percentage across a cohort: if 8 of 10 new hires hit acceptable output by day 90, that input is 80.
- Convert one-year retention into a straight percentage: 9 of 10 hires still employed at 12 months is 90.
- Average the three normalized inputs, or weight them if one matters more for the role. A technical role might weight performance at 50%, productivity at 30%, and retention at 20%.
A worked example for a sample customer success role: performance rating averages 80, productivity hits 75 (only three-quarters of new hires reached target ticket volume by day 90), and retention sits at 90. An unweighted average gives you a quality of hire score of 81.7. Weight performance and retention higher because customer-facing tenure matters more than raw speed, and the score shifts to roughly 83.
A single score means little in isolation. There's no universal benchmark. What matters is whether your own score is internally consistent, trending upward, and correlated with retention and performance in your own data over multiple hiring cohorts. A score of 75 this quarter and 82 next quarter tells you something real. A score of 82 compared against an industry average you found in a blog post tells you almost nothing, because that number was never calculated the same way you calculated yours.
Where Do You Collect Quality of Hire Data, and When?
Quality of hire data lives across systems that rarely talk to each other, which is why so many teams give up on measuring it consistently. Map each metric to its checkpoint and its system of record before you start, or the numbers will drift apart within two quarters.
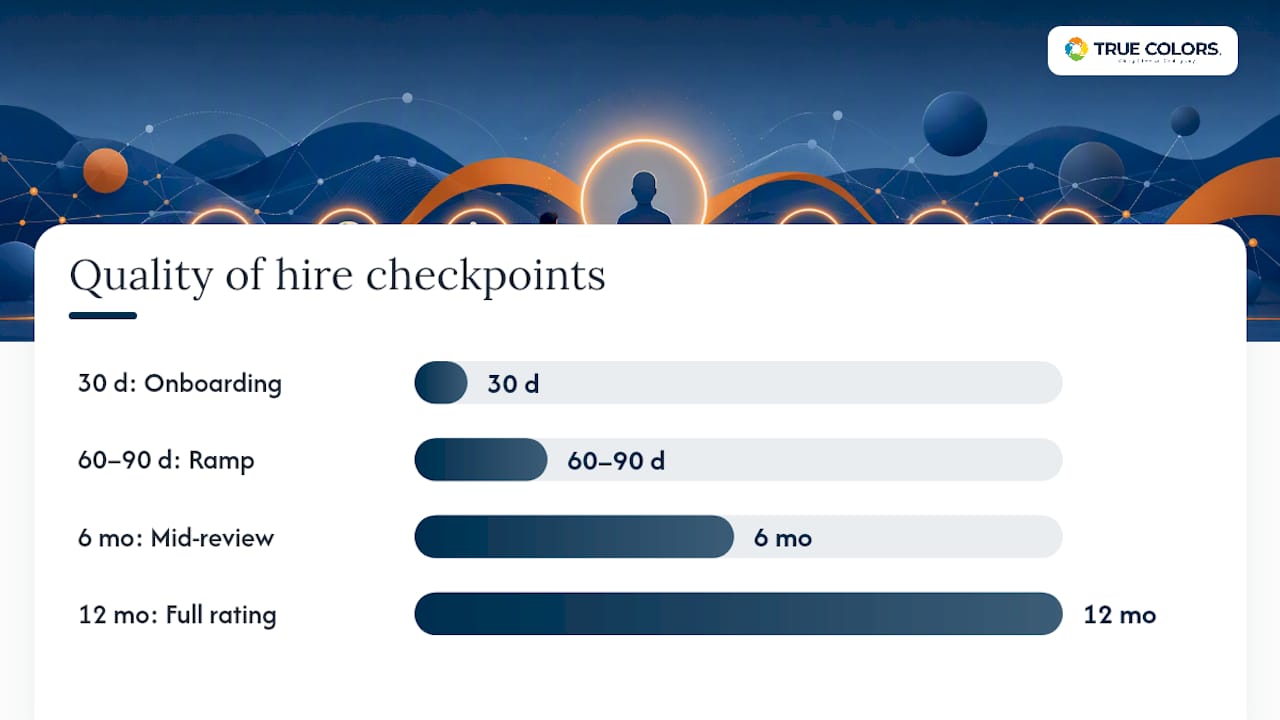
Checkpoints that work for most roles:
- 30 days: Onboarding completion, early engagement pulse, first manager check-in notes.
- 60 to 90 days: Ramp-to-productivity milestone, first formal performance check, initial hiring manager satisfaction score.
- 6 months: Mid-year performance review, 360 feedback from peers, retention status.
- 12 months: Full performance rating, one-year retention flag, second hiring manager satisfaction survey.
Measuring at these consistent intervals lets you compare across cohorts and trace outcomes back to the sourcing channel and interview process that produced them.
On systems: your applicant tracking system holds sourcing and interview data, your HRIS holds retention and compensation history, your performance platform holds ratings, and your learning management system holds onboarding completion. Assign one owner, usually someone in talent acquisition or HR operations, to pull and reconcile these quarterly.
For the manager survey, three questions go a long way: "Would you hire this person again?", "Has this person reached the productivity you expected for this stage?", and "What, if anything, would you change about how this person was hired or onboarded?" For peer or 360 input, ask: "Does this person collaborate effectively?", "Does this person communicate clearly under pressure?", and "Would you want this person on your next project?"
Preserve source attribution as you join these datasets. Tag every hire with its sourcing channel and recruiter at the point of hire, not months later when someone tries to reconstruct it from memory.
How Do You Use Quality of Hire Data to Improve Hiring?
Measurement without action is just a report nobody reads. The real value of quality of hire metrics shows up when you feed them back into sourcing, interviewing, and onboarding decisions.
- Map high-scoring hires back to their source. If your top quartile of quality of hire scores traces disproportionately to employee referrals or a specific recruiter, that's a signal to shift budget and attention toward that channel.
- Update your success profiles and interview rubrics. When a specific interview question or behavioral indicator consistently predicts high performance six months later, build it into your standard rubric. When one doesn't, drop it, no matter how established it feels.
- Target onboarding fixes at roles with long ramp times. If engineering hires take five months to full productivity while sales hires take six weeks, that gap deserves a dedicated onboarding redesign, not a generic company-wide program.
- Run small experiments before rolling out changes. Test one new interview question or one new sourcing channel against a control group of hires before applying it organizationally.
- Track quality of hire alongside cost-per-hire. A cheaper hiring process that produces lower-scoring hires isn't actually cheaper once you count replacement costs and lost productivity.
Pro Tip: Before changing your interview process, update your success profile for the role first. A success profile that spells out observable behaviors, not just skills and experience, gives your quality of hire data something concrete to validate against.
This feedback loop only works if you treat quality of hire as a living input to recruiting strategy, not a report generated once a year and filed away.
What Limits Quality of Hire Measurement?
Every organization that tries to measure quality of hire runs into the same handful of traps. Knowing them in advance saves you from building a scorecard nobody trusts by month three.
- Rating drift. One manager's "4 out of 5" is another manager's "2 out of 5." Run calibration sessions across managers before scoring cycles, and standardize the scale definitions in writing.
- Lost attribution. Sourcing data and outcome data often live in disconnected systems. Assign a single owner and a consistent join key (employee ID tied to source channel) at the point of hire.
- Small-sample noise. A single bad hire in a ten-person cohort can swing your average dramatically. Judge cohorts and trendlines over multiple quarters rather than reacting to one hire's outcome.
- Overweighting engagement or employer-brand rankings. These feel good to report but correlate weakly with actual output. Anchor your scorecard in performance, retention, and productivity first.
- Lag between hire and outcome. You won't know a hire's true one-year retention for a year. Use 30 and 90-day proxies to catch early problems, but revisit the full score at 12 months before drawing firm conclusions.
Measuring Culture and Behavioral Fit: A True Colors Approach
Culture fit is the indicator most quality of hire scorecards get wrong, usually because "fit" never gets defined past a gut feeling in a debrief meeting. Truecolorsintl approaches this by converting fit into a shared behavioral language rather than a subjective impression.

The starting point is a 3 to 5 behavior baseline for each role: a short list of observable behaviors that predict how someone will actually work with the team, not just whether the hiring manager liked them. Building this baseline makes cultural fit something you can score consistently across interviewers, rather than something that varies by who happens to be in the room.
Practically, this means:
- Inserting behavior checklists into interview guides so every interviewer scores the same three to five behaviors, not their own personal read on "vibe."
- Repeating the same checklist at 90 days as part of the onboarding assessment, so you can compare predicted fit against observed fit.
- Feeding the resulting behavioral score into your composite quality of hire scorecard alongside performance, retention, and ramp time.
Culture integration is the piece most organizations skip entirely, yet a shared behavioral language tends to predict retention and communication outcomes as reliably as performance ratings do. Treating it as a fourth measurable input, not an afterthought, closes a real gap in most scorecards.
How Do You Benchmark Quality of Hire Against Industry Standards?
External benchmarks for quality of hire don't really exist in a form you can trust, because every organization calculates the score differently, weights inputs differently, and defines "acceptable productivity" differently by role. Treating a number you found in an industry report as your target is a mistake.
The more defensible approach is internal benchmarking. Build your own baseline using last year's hiring cohorts, then measure whether this year's score trends upward, holds steady, or slips. If your composite score for engineering hires averaged 78 last year and sits at 84 this year, that's a real signal your sourcing or interview changes worked. Comparing that 84 against a competitor's self-reported 90 tells you nothing, since you have no idea how they calculated it or which inputs they included.
Where external comparison does help is at the input level, not the composite score. If industry data shows typical ramp time for a given role is 60 days and yours is 120, that gap is worth investigating even without a perfect apples-to-apples quality of hire number attached to it. Use published averages for individual metrics like turnover or time-to-productivity as a sanity check, then build your composite scoring around what predicts success inside your own walls.
Cross-department agreement matters here too. Defining "success" consistently across hiring managers, before you start comparing scores across teams or years, keeps your internal benchmark meaningful instead of just another number nobody agrees on.
How Does Quality of Hire Affect Business Outcomes?
Quality of hire isn't an HR vanity metric. A validated quality of hire index has been shown to correlate with measurable business outcomes across large enterprise samples, meaning improvements in your composite score can map to real revenue movement, not just better morale in the break room.
The mechanism is straightforward once you follow it through. A higher-performing hire ramps faster, closes more deals or resolves more tickets, and stays longer, which reduces the cost of backfilling the role and preserves institutional knowledge. A customer-facing hire with weak cultural or communication alignment, even if technically skilled, tends to generate more escalations and lower satisfaction scores from the customers they touch.
This is why quality of hire deserves a seat in business planning conversations, not just talent acquisition reviews. When finance leadership sees hiring quality tied to productivity and retention costs, quality of hire measurement stops looking like an HR project and starts looking like a lever the whole organization has a stake in pulling.
What Tools Help Automate Quality of Hire Tracking?
Manually reconciling performance ratings, retention data, and survey responses across spreadsheets is where most quality of hire initiatives quietly die. The data exists, but nobody has time to pull it together consistently every quarter.
Applicant tracking systems and HRIS platforms increasingly offer built-in analytics modules that can pull performance and retention data into a single dashboard, reducing the manual reconciliation burden. Many talent professionals still report low confidence in their quality of hire measurement, and combining better scorecards with connected data systems is the practical fix rather than waiting for a perfect all-in-one platform to appear.
For recruiting agencies and internal teams juggling multiple client or department cohorts, dedicated software for tracking recruiting operations can help keep financial and performance data aligned, which matters when you're trying to connect cost-per-hire to quality outcomes across a growing headcount.
Whatever platform you use, the goal stays the same: one dashboard, one owner, and consistent checkpoints, rather than five disconnected spreadsheets updated by five different people on five different schedules.
What Legal and Ethical Issues Come Up in Quality of Hire Measurement?
Quality of hire data touches performance reviews, survey responses, and sometimes behavioral or personality assessments, all of which carry legal exposure if handled carelessly. Any indicator you fold into a composite score should be job-related and consistently applied across candidates and employees in comparable roles, not selectively used to justify decisions after the fact.
Personality and behavioral assessments deserve particular care. Used to inform interview design or onboarding conversations, they add real value. Used as a pass/fail gate in hiring decisions without validation against job performance, they create legal risk and can introduce bias against protected groups. If your organization uses temperament or personality-based tools anywhere in the hiring or evaluation process, review how those assessments can be used legally before building them into your scorecard.
Retention and performance data also require privacy discipline. Employees should understand what's being measured and why, and access to individual scores should be limited to people with a legitimate business reason to see them. Aggregating data into cohort trends, rather than publicizing individual scores, protects both the employee and the organization.
Finally, watch for disparate impact. If your quality of hire scoring consistently produces lower results for hires from a particular channel or demographic group, that pattern needs investigation before you use the score to justify future hiring decisions.
Quality of Hire Is a Business Metric, Not an HR Report
Quality of hire measurement fails most often because it stays trapped inside talent acquisition, owned by one recruiter, reviewed once a year, and disconnected from the managers and finance leaders who actually feel its impact. The fix isn't a better spreadsheet. It's shared ownership across TA, HR, hiring managers, and finance, each accountable for the piece of data they control.
Start with one role, not the whole organization. Pick a high-volume or high-cost position, build a simple composite score, and run it for two hiring cycles before expanding. Leaders who wait for a perfect system never start measuring at all.
— Theresa
Turn Culture Fit Into a Measurable Hiring Input With Truecolorsintl
Most quality of hire scorecards stall on the same input: culture fit, because nobody has agreed on what it actually looks like in observable behavior. Truecolorsintl closes that gap with a practical, behavior-based system that turns personal awareness into aligned action across your hiring process, not just another personality quiz filed away after onboarding.

The Individual Personality Assessment Consultation gives hiring teams a structured way to define behavioral baselines for a role, with current pricing details available on the True Colors website, so you're not guessing at what "fit" means for your next hire. Pair that with an Employee Experience Survey to capture the 360 and engagement signals your composite scorecard needs, and Team Building Training to reinforce the behaviors you identified during hiring once someone is actually on the team. These pieces connect directly to the interview rubrics and onboarding checkpoints already covered above, so culture fit becomes a score you track, not a conversation you have once and forget.
If you're ready to build behavioral baselines into your next hiring cycle, start with a personality assessment consultation and see how a shared behavioral language changes what your quality of hire scorecard can actually predict.
Sources
For deeper reading on quality of hire formulas, benchmarking, and common pitfalls, consult SHRM's guidance on measuring quality of hire, ERE's breakdown of the recruiting metric formula, Crosschq's analysis of quality of hire as a latent metric, and Joveo's overview of benchmarking and measurement. These sources back nearly every formula, checkpoint, and pitfall covered above.
- Quality of Hire: The Top Recruiting Metric | ERE
- Quality of hire, quantified — how to define and measure a historically complex metric.
- What Is Quality of Hire? Definition and How to Measure It (2026)
FAQ
What Is a Quality of Hire Metric?
A quality of hire metric is a measurable indicator, like performance rating, retention, or ramp time, used to assess how much value a new employee creates after joining. Most organizations combine several of these into a single composite score rather than relying on one number.
How Do You Measure the Quality of a New Hire?
Track performance against role expectations, first-year retention, time to full productivity, and hiring manager satisfaction, then combine them into a weighted or averaged composite score. Measure at standard checkpoints, typically 30, 90, and 365 days, to build a reliable trendline rather than a single snapshot.
What Are Quality Metrics in Hiring?
Quality metrics in hiring refer to indicators like job performance, retention rate, ramp-to-productivity time, hiring manager satisfaction, and behavioral or cultural alignment. Together, these form a picture of whether a hire is succeeding, not just whether the position got filled.
How Do You Measure Employee Quality After Hiring?
Employee quality is best measured by comparing actual on-the-job performance and retention against the success profile defined before the role was filled. Truecolorsintl's behavior-based assessments can help define observable success criteria upfront, making post-hire measurement more consistent across managers.
Is There an Industry Benchmark for Quality of Hire Scores?
No universal benchmark exists because organizations calculate and weight quality of hire differently. The more useful approach is comparing your own scores over time, since a score that trends upward and correlates with retention in your own data matters more than any external number.