
There is no universal benchmark for a "good" survey response rate. The single highest-impact move is combining multimode delivery with a genuine relationship to your audience, and reporting your rate using a standard AAPOR definition so anyone comparing numbers is comparing the same thing.
TL;DR:
- Using multimode delivery and building trust with respondents significantly increases response rates, with full protocols reaching mid-30s percentages.
- Response rates vary widely by channel, with employee surveys achieving 30-60% and cold external surveys often falling below 10%.
- Sample size determines survey validity more than response rate, especially in small populations where fewer responses are needed for accurate results.
- Improving participation relies on short, mobile-first surveys, genuine relationship-building, personalized invitations, and deliberate reminder scheduling.
- Transparency in reporting survey methodology, including response rate formulas and delivery modes, is essential for evaluating data quality and credibility.
Table of Contents
- How Do You Calculate a Survey Response Rate?
- What Are Typical Response Rates by Channel and Survey Type?
- How Many Responses Do You Actually Need?
- What Actually Moves the Needle on Response Rates?
- How Do You Actually Increase Survey Responses?
- How Do You Know If Your Response Rate Is Actually Good?
- What Do Recent Trends Mean for Survey Designers?
- What Should You Report for Transparency?
- Why Trust Drives Participation More Than Design
- A Practical Next Step for Organizational Surveys
- Sources
How Do You Calculate a Survey Response Rate?
Survey response rate is the number of completed or partially completed surveys divided by the number of people invited who were eligible to respond. Completion rate is a different number: it measures how many people who started the survey actually finished it, which tells you about survey design and length rather than outreach effectiveness.
The math gets messy at the denominator. Do you count people whose eligibility you never confirmed? Do partial interviews count as full responses, half responses, or not at all? The American Association for Public Opinion Research built six standard formulas, RR1 through RR6, specifically because these choices swing the reported percentage by ten points or more on the same dataset.
- RR1 counts only complete interviews against all cases, including unknown eligibility.
- RR3 and RR4 estimate the proportion of unknown-eligibility cases that would have qualified.
- RR6 treats all partial interviews as complete.
Two researchers can survey the same population and report different rates depending on which standard formula they pick from AAPOR definitions. That is why stating your AAPOR definition is not academic housekeeping. It is the only way your number means anything to someone else.
What Are Typical Response Rates by Channel and Survey Type?
Channel matters more than almost any other variable. A peer-reviewed meta-analysis of 1,071 online surveys found an average online response rate of about 44.1%, driven largely by well-defined samples and pre-contact with respondents before the survey landed. Platform-level data tells a rougher story for less curated audiences.
By the numbers: One large benchmark analysis of 4,332 surveys found an overall median response rate near 10%, with mobile in-app surveys at 18.7%, website widgets at 7.6%, and chat-intercept surveys trailing at 5.4%.
Rough ranges by format:
- Email surveys: wide variation, but SurveyMonkey's benchmark data shows opted-in lists consistently outperform cold outreach.
- Mobile in-app: median around 18.7%, among the strongest digital channels.
- Web link and popup intercepts: typically single digits, 5% to 8%.
- Employee surveys: often 30% to 60%+ when leadership visibly acts on results.
- B2B and academic panels: highly variable, often 20% to 40% for relationship-based samples.
The gap between a customer NPS survey and an employee engagement survey isn't really about survey design. It's about how much trust already exists before the invitation goes out.
How Many Responses Do You Actually Need?
Sample size, not response rate, determines statistical validity. These figures come from standard survey-sampling math and assume a simple random sample.
Smaller populations need a finite-population correction. If you are surveying a department of 200 employees rather than a market of millions, the required completions drop sharply, sometimes to well under 150.
Response rate enters the picture when you plan invitations, not when you calculate validity. Confusing the two numbers is one of the most common planning mistakes in survey research: needing N responses is a sampling question, while expecting a certain response rate is an outreach question.
What Actually Moves the Needle on Response Rates?
Controlled experiments and large-sample benchmarks converge on a short list of factors that reliably change participation, and it's shorter than most survey guides suggest.
- Mode matters, and multimode wins. The HCAHPS/CMS hospital-survey experiments found mail-only protocols reaching just above 20%, phone-only somewhat higher, mail-plus-phone in the low 30% range, and full web-plus-mail-plus-phone protocols around the mid-30%s, representing a 10 to mid-teens percentage-point lift over single-mode delivery.
- Relationship and trust outperform almost everything else. Employees and opted-in customers respond at multiples of what cold external panels achieve.
- Length kills completions before it kills starts. Micro-surveys of two to three questions substantially outperform longer instruments in platform benchmark data, and mobile-first design keeps that advantage on the device people actually check.
- Pre-contact and reminders compound. The same meta-analysis linking a 44.1% average response rate to refined sampling also found that notifying people before the survey arrives can measurably lift completion rates.
- Incentives are situational. They help with cold, low-relationship audiences but show mixed or negligible effects once trust and relevance are already high.
Pro Tip: Before spending budget on incentives, check whether your real problem is mode or relationship. An incentive rarely fixes a survey nobody trusts.
How Do You Actually Increase Survey Responses?
A practical rollout beats a clever gimmick almost every time. Here is a sequence that reflects what the evidence above actually supports, not what sounds appealing in a planning meeting.
- Match the channel to the audience. Internal, opted-in populations tolerate email; cold external audiences need multimode outreach to hit respectable numbers.
- Send a short pre-notification. A brief heads-up before the survey lands, explaining purpose and time commitment, consistently lifts eventual participation.
- Design for mobile first. Keep it to five questions or fewer where possible, and test the survey on a phone before launch, not after.
- State the purpose plainly. People respond faster when they know what happens with their answers and who sees them, a point echoed in guidance on effective survey design.
- Personalize the invitation. A name and a specific reason for asking outperform a generic blast every time it has been tested.
- Space reminders deliberately. A common cadence is day 1 (invite), day 4 (reminder), day 8 (final reminder), adjusted for your typical response curve.
- Reserve incentives for the hardest-to-reach segments rather than the whole list.
- Track cohorts and A/B test subject lines and timing, comparing response curves week over week rather than guessing.
Pro Tip: Run your reminder cadence as a real experiment. Split your list, vary only the reminder timing, and let the data tell you the schedule instead of copying a template.
How Do You Know If Your Response Rate Is Actually Good?
Chasing a specific percentage misses the point. A validity-assessment framework from academic survey-methodology research argues that response rate alone is a weak proxy for data quality, and recommends checking it against contextual evidence instead.
- Sampling-frame quality: was the invite list accurate and current?
- Relationship to respondents: internal, opted-in, or cold contact?
- Demographic representativeness: do respondent demographics mirror the invited population?
- Mode effects: did different channels produce different answer patterns?
- Sensitivity of key measures: would your main conclusions change if nonrespondents answered differently?
Simple diagnostics catch most problems early: compare early responders to late ones, check whether any demographic group is underrepresented, and run a small targeted follow-up with a nonresponse sample. Evidence on the relationship between response rate and accuracy shows that a low rate doesn't automatically mean biased results, but it does mean you need to check rather than assume.
What Do Recent Trends Mean for Survey Designers?
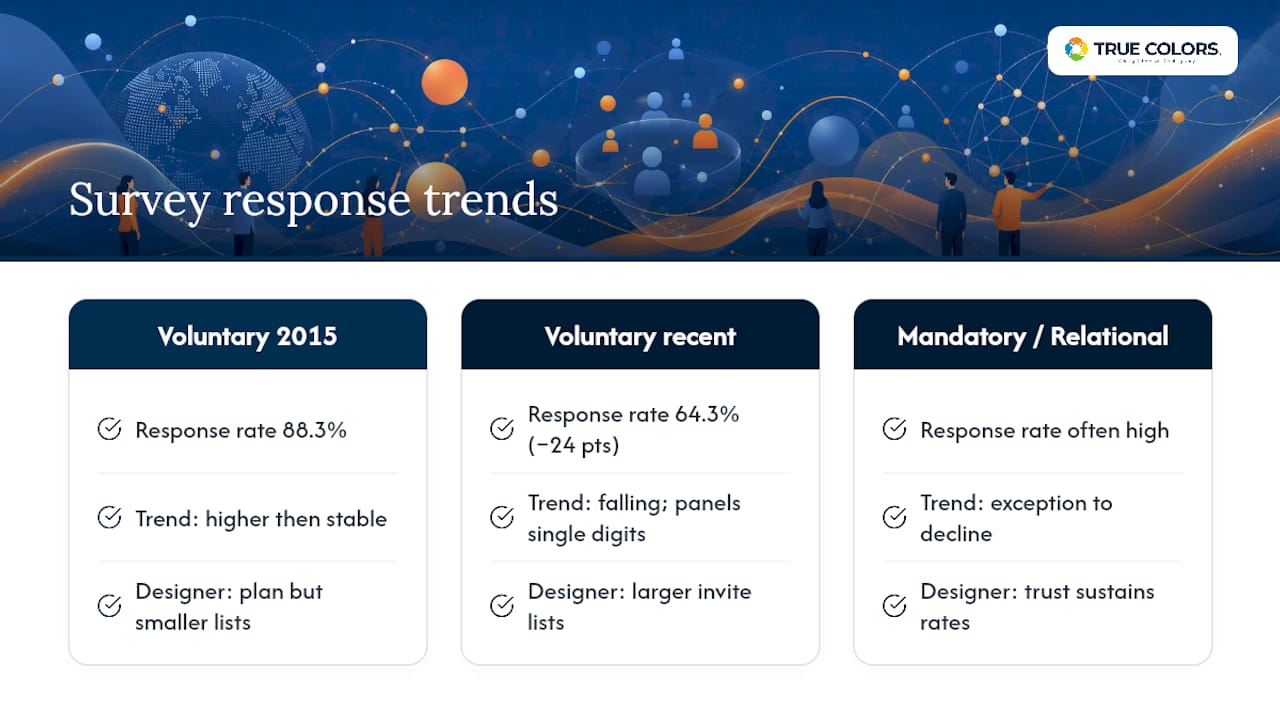
Voluntary participation is trending down almost everywhere. The Current Population Survey's response rate fell from 88.3% in 2015 to roughly 64.3%, a 24-point drop over a decade, and many voluntary panels now sit in single digits.
Plan around this reality rather than fighting it: build larger invite lists than you think you need, default to multimode delivery, and budget time for validity checks instead of assuming a clean number. Mandatory surveys and highly relational ones (tight-knit teams, small membership groups) remain the exception, still capable of reaching high rates when trust is already established.
What Should You Report for Transparency?
Reporting your methodology is what turns a number into evidence. At minimum, your methods section should state:
- Which AAPOR response-rate definition (RR1 through RR6) you used
- How partial completions and unknown-eligibility cases were handled
- Every mode of delivery used (email, phone, web, mail)
- Number and timing of reminders sent
- Whether incentives were offered and to whom
A workable methods statement reads something like: "We invited 1,200 eligible employees by email and mobile app, sent two reminders on days 4 and 8, offered no incentive, and calculated response rate using AAPOR RR3 to account for undeliverable addresses."
Why Trust Drives Participation More Than Design
Employees don't skip surveys because the questions are poorly worded. They skip them because they don't believe anything will change, or they doubt their answers stay confidential. Confidentiality safeguards are essential in organizational surveys because participation follows trust, not survey mechanics. A leadership team that visibly acts on findings will outperform any incentive budget.
— Theresa
A Practical Next Step for Organizational Surveys
Better design and multimode delivery only get you so far when employees don't trust what happens to their answers. That is the gap Truecolorsintl's Employee Experience Survey is built to close: a behavior-rooted survey system with confidentiality safeguards built in from the start and a clear path from findings to action, not just a report that sits in a folder.

Instead of running a survey and hoping participation holds up, organizations get a system designed around the two things this article keeps returning to: relationship and follow-through. Pair survey findings with the Connected Leadership Program to make sure leaders act on what employees actually said, closing the loop that keeps future response rates healthy. If your organization is planning its next employee survey, start by reviewing what a confidentiality-first, action-oriented survey program looks like and consider how such a program could fit your team.
Sources
- Response rates of online surveys in published research: A meta-analysis
- Survey response rate definitions and AAPOR explanation (NCBI/PMC)
- State of Survey Response Rates 2026 — SpaceForms Research
- 2025 Benchmark Report: What's a Good Survey Response Rate? (Survicate)
- Survey response rate benchmark guide (SurveyMonkey)