
Organizational culture measurably affects firm market performance. The evidence is clear enough to act on and nuanced enough to demand precision. A one standard deviation increase in employees' perceived trust in management is associated with a 0.19 standard deviation increase in Tobin's q and a 0.09 standard deviation increase in profitability. The single highest-leverage first step for any executive: measure how employees actually perceive managerial integrity, not what your values poster says.
What the numbers mean in practice: A 0.19 SD lift in Tobin's q is a meaningful valuation signal at scale. It is not a guarantee, but it is large enough to justify a serious measurement and intervention program.
- Culture's link to objective financial metrics is real but moderate; subjective outcomes (engagement, trust) show stronger correlations.
- The mechanism runs through behavior, not belief: what leaders repeatedly do shapes norms, which shape decisions, which shape results.
- Integrity and adaptability are the two cultural elements most consistently tied to firm value across large-sample studies.
Table of Contents
- What the evidence actually shows about culture and firm performance
- How culture translates into measurable outcomes
- Which cultural elements most reliably link to performance
- Leader behaviors that reliably move the needle
- How to measure culture credibly and link it to business outcomes
- Designing high-impact, behavior-first culture interventions
- What to expect at each stage: timelines and realistic ROI
- Key Takeaways
- Why culture change requires leaders to own the behavior, not just the message
- What Truecolorsintl offers executives ready to act
- Selected research and resources to read next
What the evidence actually shows about culture and firm performance
The academic literature on market performance and culture is substantial but uneven. Meta-analyses find the mean correlation between culture and performance is roughly 0.16 when measured across diverse constructs, with correlations for objective financial outcomes often near 0.10 and correlations for subjective measures reaching 0.40 in some reviews. The CIPD's 2023 evidence review concludes that findings are mixed and that measurement heterogeneity makes direct comparison across studies difficult.
Large-sample work is more encouraging. A study of 3,034 U.S. firms from 2002 to 2013 found that employee-friendly cultures, characterized by higher compensation, better training, and equal advancement opportunities, were associated with higher ROA, ROE, and Tobin's q. The pathway appears to run through technical efficiency and innovation capacity rather than through any single HR practice.
Key caveats leaders should hold alongside the findings:
- Most studies are cross-sectional, making causal claims difficult to establish with certainty.
- Sample-selection bias is common: firms that measure culture well tend to be better-managed overall.
- Advertised values are weak predictors of performance; employee-perceived integrity is the stronger signal.
- Public firms face governance pressures that can erode cultural investments over time.
How culture translates into measurable outcomes
Culture does not affect performance directly. It works through a chain: shared behavioral norms shape individual decisions, which aggregate into operational patterns, which eventually show up in financial results. Understanding the chain lets you intervene at the right point.
The five primary pathways:
- Reduced earnings management is a governance benefit: a large-sample study covering 55,623 firm-year observations from 2002 to 2021 found that firms with stronger cultures were less likely to report special items, suggesting stronger cultures constrain opportunistic accounting.
Pro Tip: Map your culture intervention to a specific pathway before designing it. A program targeting trust will use different behaviors and metrics than one targeting innovation. Conflating them produces programs that are too broad to measure.
Which cultural elements most reliably link to performance
Not all cultural traits carry equal weight. Research by O'Reilly and colleagues identifies specific elements with distinct performance associations:
- Integrity and trust — consistently link to higher firm valuation and analyst recommendations. This is the element with the strongest and most replicated empirical signal.
Context matters. A high detail-orientation culture in a startup can slow the iteration speed that drives early growth. An adaptability-first culture in a regulated financial firm can create compliance risk. The goal is fit between cultural profile and strategic context, not a universal ranking.
Leader behaviors that reliably move the needle
CEO personality shapes organizational culture, and culture in turn predicts financial and reputational outcomes. That causal chain places a specific responsibility on leaders: your observable daily behaviors are the primary culture-shaping mechanism available to you.
Behaviors with the strongest empirical backing:
- Transformational leadership behaviors, including individualized consideration and intellectual stimulation, mediate the culture-to-performance link through innovation and dynamic capabilities, as a systematic review of 54 studies confirms.
A longitudinal study published in Nature Scientific Reports found that employee development and communication behaviors positively relate to well-being, while workplace strategy behaviors can show short-term profit target gains but require sustained context to hold. The implication: behaviors that build well-being tend to produce durable financial results; behaviors that push short-term targets often do not.
Pro Tip: Coach managers on three specific micro-behaviors per quarter rather than broad competency frameworks. Specificity drives consistency, and consistency is what changes norms.
How to measure culture credibly and link it to business outcomes
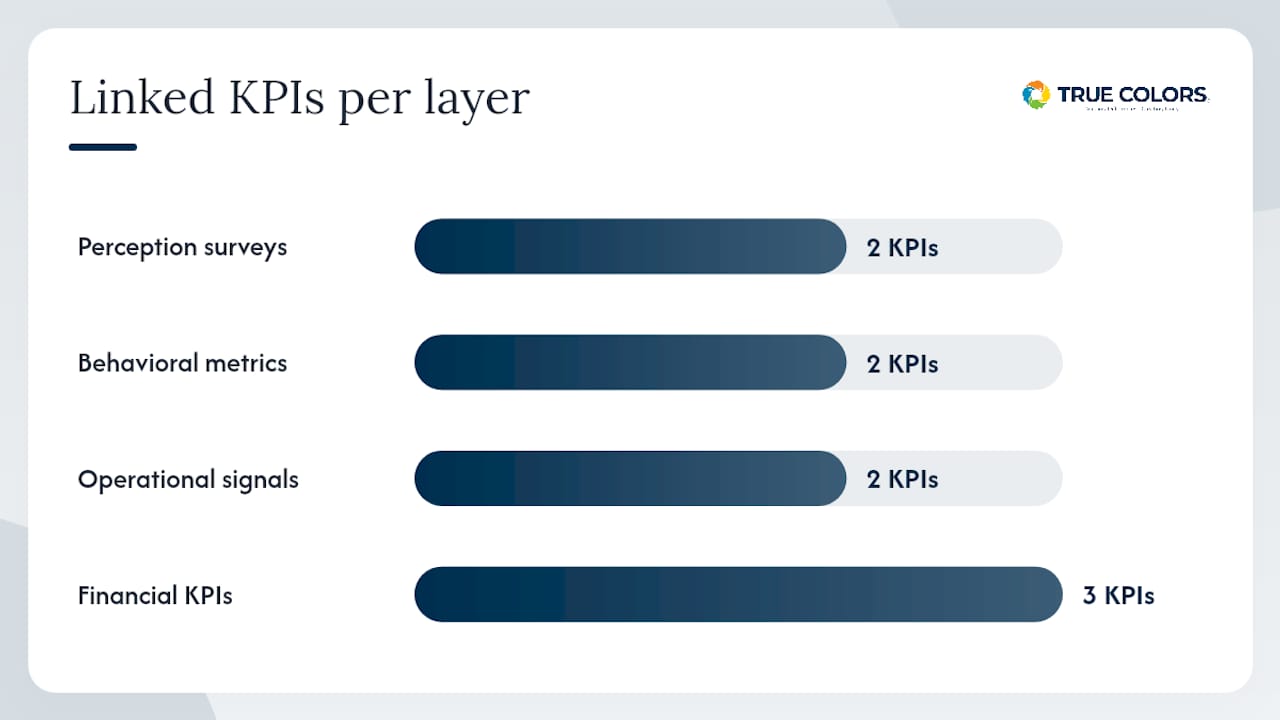
| Measurement layer | What to track | Linked KPI |
|---|---|---|
| Perception surveys | Managerial integrity, psychological safety, trust | Tobin's q proxy, retention rate |
| Behavioral metrics | Development conversation frequency, communication cadence | Engagement score, absenteeism |
| Operational signals | Error rates, cycle times, cross-team collaboration | ROA, efficiency ratio |
| Financial KPIs | ROE, ROA, revenue growth | Lagging confirmation of culture signal |
A credible measurement program follows this sequence:
- Select validated survey items measuring perceived managerial integrity and trust, not satisfaction proxies.
- Establish a behavioral baseline: how often do managers hold development conversations? How is strategy communicated?
- Design a pilot with a treatment group, a comparable control group, and a 6-month baseline/endline structure.
- Track leading indicators monthly (engagement, trust scores) and lagging indicators quarterly (retention, ROA).
- Present causal claims cautiously: use "associated with" rather than "caused by" until you have longitudinal data.
Measurement fragmentation is the most common failure mode. Many organizations use different survey instruments across business units, making aggregation impossible. Standardize on a small set of validated items before scaling.
Designing high-impact, behavior-first culture interventions
A behavior-first playbook follows five steps:
- Define the target behavior with enough specificity that a manager could demonstrate it in a meeting. "Be more transparent" is not a behavior. "Share one piece of difficult business news in every team meeting" is.
- Design micro-interventions: short training modules, manager scripts, and team rituals that make the behavior easy to practice repeatedly.
- Pilot with measurable KPIs: run the intervention in two to three business units for 90 days with clear baseline and endline measures.
- Iterate based on data: adjust the behavior definition or delivery mechanism before scaling.
- Scale with governance: embed the behavior in manager performance reviews and onboarding so it persists beyond the initial program.
Timeline milestones to set with your board:
- Months 1–3: Behavioral baseline established; pilot launched; trust/integrity scores collected.
- Months 3–6: First endline survey; early retention signal visible; manager behavior frequency tracked.
- Months 6–18: Engagement and retention trends confirmed; operational metrics begin to shift.
- Months 18–36+: Financial KPI movement detectable; culture embedded in governance processes.
Risk mitigation priorities:
- Avoid overbroad values campaigns that produce no measurable behavior change.
- For public companies, design compensation and performance metrics that protect cultural investments from quarterly pressure.
- Never claim financial causation from a single survey cycle; build the longitudinal case over time.
What to expect at each stage: timelines and realistic ROI
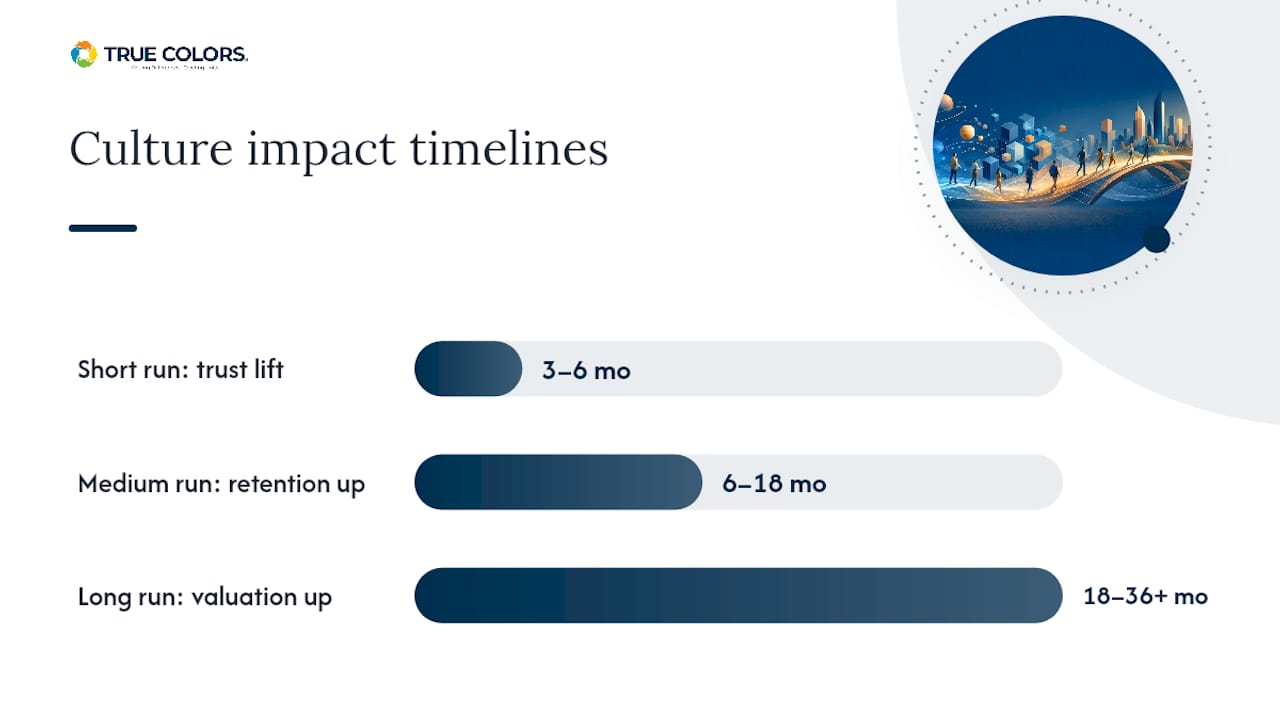
| Phase | Timeframe | Typical signals | Notes |
|---|---|---|---|
| Short run | 3–6 months | Trust/integrity score improvement, engagement lift | Leading indicators only; no financial signal yet |
| Medium run | 6–18 months | Retention improvement, reduced absenteeism | Operational metrics begin to shift; ROA movement possible |
| Long run | 18–36+ months | Tobin's q proxy improvement, profitability gains | Financial signal detectable with longitudinal data |
ROI framing for board discussions should anchor to the effect sizes the research supports: a meaningful but not guaranteed lift in firm valuation and profitability, contingent on sustained behavioral change and measurement discipline. Private firms typically see faster cultural movement because they face less short-term market pressure. High-dynamism industries (technology, professional services) tend to see stronger returns from adaptability-focused programs; stable industries see stronger returns from integrity and detail-orientation investments.
Connecting culture programs to lasting business results requires patience with the timeline and rigor with the measurement. The organizations that fail are usually those that declare success after a single survey cycle.
Key Takeaways
Organizational culture affects market performance through specific behavioral mechanisms, and the leaders who measure integrity, develop managers deliberately, and sustain behavioral change over 18-plus months are the ones who capture the financial signal the research identifies.
| Point | Details |
|---|---|
| Measure integrity first | Employee-perceived managerial integrity is the strongest single culture signal linked to firm valuation. |
| Effect sizes are real but moderate | A 1 SD increase in perceived trust associates with a 0.19 SD increase in Tobin's q and 0.09 SD in profitability. |
| Behavior specificity drives results | Named micro-behaviors outperform broad values campaigns; define behaviors precisely before piloting. |
| Expect an 18-month minimum | Financial KPI movement typically requires 18–36 months of sustained behavioral change and measurement. |
| Truecolorsintl provides the system | Truecolorsintl's assess-align-embed-measure model translates behavioral diagnosis into trackable business outcomes. |
Why culture change requires leaders to own the behavior, not just the message
The most consistent finding across this body of research is one that leaders often resist: culture is not what is said. It is what is repeated. A values statement that no one can observe in their manager's daily behavior is not a culture asset. It is noise.
What the evidence actually demands is behavioral accountability at the leadership level. That means integrating culture metrics into executive performance reviews, not just employee engagement surveys. It means treating a decline in managerial integrity scores with the same urgency as a decline in gross margin. And it means resisting the temptation to declare a culture program successful before the longitudinal data exists to support the claim.
The organizations that sustain culture-driven performance gains share one structural feature: their senior leaders treat observable behavior as a governance responsibility, not a communications exercise. That shift in framing is harder than any training program, and it is the one that actually moves the needle.
What Truecolorsintl offers executives ready to act
Most culture programs stall because they start with values and end with a survey. Truecolorsintl starts with behavior and ends with a measurement cycle tied to business outcomes. The approach combines behavioral assessments, leadership development programs, employee experience diagnostics, and ongoing reinforcement systems designed for medium-to-large U.S. organizations that need culture change to show up in results, not just in engagement scores.

For executives ready to move from diagnosis to action, the right starting point is an employee experience survey that measures perceived managerial integrity and trust at baseline, giving you the data to design a targeted pilot and defend the investment with your board. Reach out to Truecolorsintl to scope a diagnostic engagement built around your organization's specific performance gaps.
Selected research and resources to read next
- The value of corporate culture ☆
- Organisational culture and performance: an evidence review. Scientific summary
- Corporate culture and the likelihood of reporting special items (MDPI, 2024)
- Transformational leadership and firm performance: a systematic literature review
- Leader behaviors, employee well-being, and branch-level financial performance (Nature Scientific Reports, 2026)